Safe Streets, Strong Neighborhoods
A city with safe neighborhoods is a strong city, and safe neighborhoods do not exist if the streets are unsafe.
Toledo will never be the city it can be, if our residents are afraid of walking their dog, teaching their kid to ride a bike, or even going for a walk with their grandparent. When motorists use our residential streets as their shortcut around traffic, or even their personal racetrack, they are ruining our neighborhoods.
Data to consider:
In 2019 Toledo was designated the 64th most dangerous metro for pedestrians in the US.
From 2016 to 2019 our PDI (Pedestrian Danger Index) went up 1.6 (Source)
13 of the top 20 Severe Crash Hotspots as categorized by TMACOG fall under City of Toledo Authority. (Page 67) (Source)
From Crash data obtained from Toledo Metropolitan Area Council of Government (TMACOG), there were 919 reported crashes involving a pedestrian or bicyclist within the Washington Local Safe Routes to School study area from 2013-2017. The table on page 15 summarizes the data identifying the crashes that resulted in injuries, and those that resulted in fatalities (source: TMACOG). The table also identifies the # of crashes that involved either a pedestrian or bicyclist. Overall, 533 crashes involve pedestrians and 375 involved bicyclists. These crashes resulted in 65 fatalities. (Table below)
A neighborhood with less speeding is a more kid friendly, bike friendly, disability friendly, pedestrian friendly neighborhood. It’s just more people friendly.
So how do you slow down traffic, and speed up safety in Toledo neighborhoods?
In consultation with community leaders, after gaining insight from best practices throughout the country, and after conversation with leadership in the Administration I have assembled a 6 point “Safe Streets, Strong Neighborhoods” Plan. Three steps to take in the short term, three areas of focus in the long term.
Short Term (Timeline: 6-12 months)
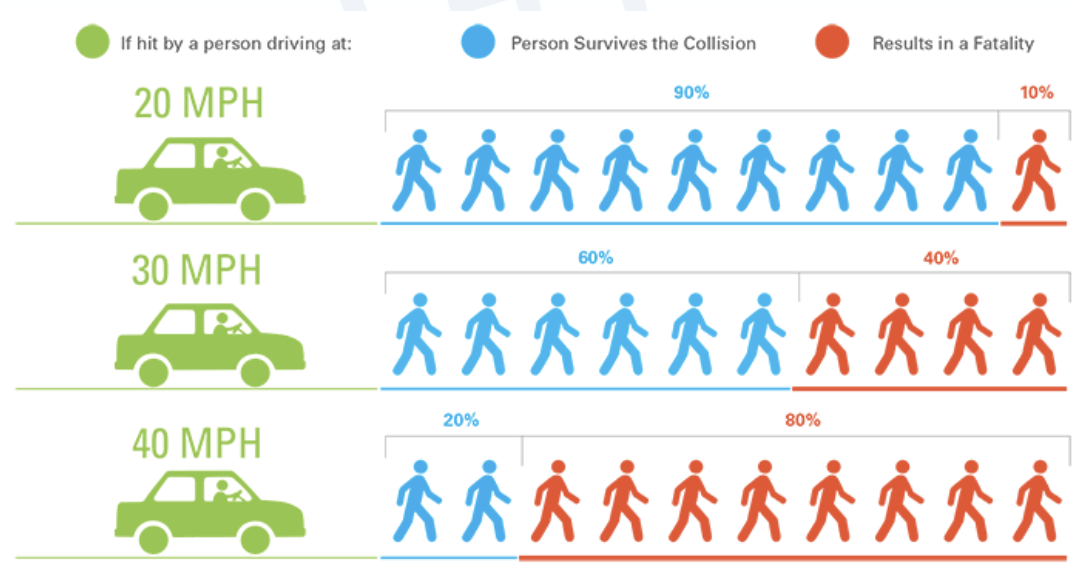
City Wide Analysis of Speed limits. One way to slow traffic? Lower speed limits. Did You Know… Almost every speed limit decreases as the street leaves Toledo city limits. We have to think more of ourselves as a city than that. Every neighborhood in the city of Toledo deserves the dignity of careful drivers.
Improve Signage. By opening up a “Sign-request” option in Engage Toledo. (Stop signs, yield, etc) we will be able to give Toledoans more influence over the process by which signs are posted throughout their community.
Double Fines for Speeding on Residential streets. When you go over the speed limit in a construction zone, you know you are going to pay more if you get caught. Why? Because people are close by, and you could kill them. That is obviously true in our neighborhoods, and motorists need to apply the same level of care to our neighborhoods that they would when they see orange cones on the highway. (Legislation before council now.)
Long Term (2-10 years)
Cut down on Cut throughs. Examine cut through streets, looking for opportunities to close streets where beneficial
Prioritize Pedestrians. We must do whatever we can to increase overall volume of cross walks, and other pedestrian friendly infrastructure to let pedestrian travelers know they are safe, and welcome in Toledo.
Build Safety In. We need to develop a strategy for building diversion and speed reduction into street redesign/reconstruction, using common traffic calming methods.
Double Fines FAQ’s
What are the costs?
The only perceived costs at this point are related to the slow implementation of additional signage under current speed limit signs. Additional signage is not mandatory to implement the program, but necessary for increased transparency and public trust.
Estimates are:
Cost per sign: $20 produced and installed
Speed limit signs on residential streets: Roughly 3,400
Total cost of signage: $68,000
How do we define residential streets?
Residential Streets simply refer to neighborhood streets where the speed limit is 25 MPH and “through streets” where the speed limit is 35 MPH (as outlined in TMC 333.03 “Twenty-five miles per hour in all other portions of the Municipality, except on State routes outside business districts, through streets and through highways outside business districts, and alleys” and “Thirty-five miles per hour on all through streets within the Municipality outside business districts”)
Assuming this increase generates revenue, where will the money be spent?
One of the highlights of this program is how the revenue will be used. We are working to ensure 100% of the revenue created will be spent on speed reducing items or park improvements
Signs of all kinds. (Speed limit, stop, yield, “Your Speed”, etc)
Speed reducing infrastructure.
Park improvements
How does this ordinance interact with speed cameras?
This new law is not reliant on speed cameras of any kind. But the truth is, speed cameras that were more acceptable to the majority of Toledoans would improve the program.
The most common complaint against speed cameras is simple: Toledoans don’t know when the cameras are coming or where the money is going. This program has already solved the latter by allocating all funds toward neighborhood improvements. Perhaps with more transparent notice about the presence of speed cameras, they could be implemented to help keep our neighborhoods safer as well.
Other Items to Consider:
Info from Toledo Public Safe Routes to Schools Report
Relevant traffic crashes. Crash data was obtained from the Ohio Department of transportation and the Toledo Metropolitan Area Council of Government (TMACOG), our local MPO. There were a total of 6,860 crashes within the STP study area from 2013-2017. The table below summarizes the data identifying the crashes that resulted in injuries, and those that resulted in fatalities (source: TMACOG). The table also identifies the # of crashes that involved either a pedestrian or bicyclist. Overall, 3,167 crashes involve pedestrians and 3.065 involved bicyclists. These crashes resulted in 205 fatalities.
Traffic Crash 2013-2017 Report


